Unlocking Business Insights with TallyPrime Reports
Reports in TallyPrime aren’t just static documents; they are dynamic tools for auditing, filing, and data-driven decision-making. Whether you need a high-level Dashboard view or a granular Transaction drill-down, the system is built for speed and flexibility.
1. Navigation & Discovery
TallyPrime makes finding data intuitive through two primary methods:
-
The Traditional Path: Drill down through the Gateway of Tally to find reports organized by their functional groups (Accounts, Inventory, etc.).
-
The Modern Path: Use the Go To (Alt+G) feature to search for any report instantly from any screen without closing your current work.
2. Interaction Shortcuts
Efficiency is driven by keyboard fluency. TallyPrime 2.0.1 and later versions include a Bottom Bar to remind you of these actions:
-
Enter: Drill down into any line for more detail.
-
Alt+F5: View the full details of a transaction.
-
Line Management: Use standard shortcuts to select, remove, restore, or delete lines within a report.
3. Advanced Configuration & Analysis
Every report features a Right Button Bar that allows you to pivot the data instantly:
-
Periodicity: Change the date range to view daily, monthly, or yearly performance.
-
Value Scaling: Display amounts in different factors (e.g., Crores, Hundreds) or base currency.
-
Contextual Filters: Toggle specific information like Profit Margins or Post-dated Transactions to refine your analysis.
4. Collaboration & Sharing
Sharing data with CAs, stakeholders, or customers is integrated directly into the workflow:
-
Export/Print: Generate physical or digital copies for your records.
-
Direct Communication: Send Reminder Letters, Confirmation of Accounts, or Financial Reports via Email or WhatsApp on the fly.
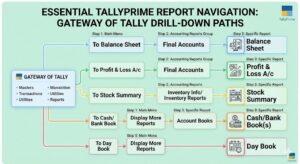
Navigate to Reports | Gateway of Tally & Go To vs Switch To
TallyPrime offers two distinct ways to find your data. Think of it like a Library: You can either walk through the aisles (Gateway) or use the digital catalog (Go To)
Why use “Go To” instead of the Gateway?
-
Multitasking: You can be in the middle of a Sales Invoice, use Go To to check a customer’s previous balance, and then press Esc to return exactly where you left off in the invoice.
-
Speed: You don’t need to remember the path. Just type “Balance Sheet” or “Stock Summary,” and it appears instantly.
-
Zero Navigation: You can access any report from any screen in the software.
- Press Alt+G (Go To) > type of select a report and press Enter.
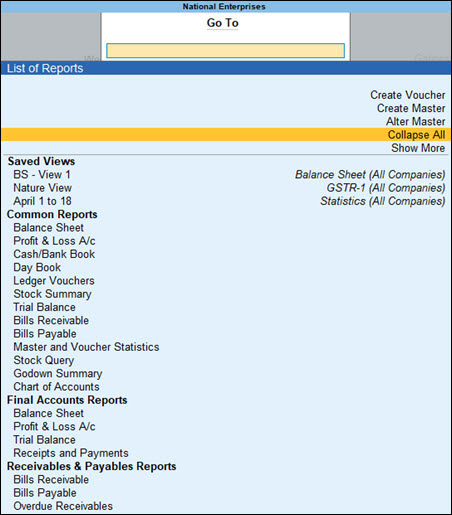
Alternatively, Gateway of Tally > Display More Reports > drill down to different groups and select the required report.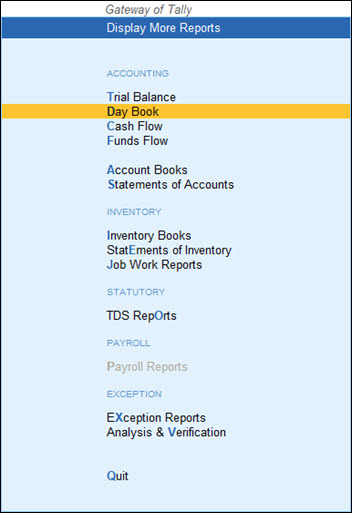
- You can also press Expand All to see all the reports upfront under each group. Reports that are less frequently used are generally not shown by default. Press Show More to list all the reports under Go To.
For more details on using Go To, refer to Get Familiar with TallyPrime.
View Report Details
In your business, when you record all your transactions, you will certainly want to view different reports to track the transactions and analyse your business performance. Reports in TallyPrime, by default display your company name, report name, period for which the report is open, and column and rows with specific inputs from your transactions.
For example, to analyse the financial health of your company, you can refer to the financial reports like Balance Sheet, Profit & Loss Statement, and so on. Similarly, the outstanding reports display details of your funds receivables and payables; the cash flow and funds flow reports display the fund projections for your business; and so on.
As you navigate within TallyPrime, all your reports are logically classified based on the report types. Reports like Balance Sheet and P&L Statement are grouped under Final Accounts; Bank Reconciliation and e-Payments are grouped under Banking Utilities; and so on.
What’s more! You can quickly drill down on each line in a report to explode and view specific details, as part of the same report or in a separate report.
1. Explode/collapse details of a single line entry in the same report: Select a line > press Shift+Enter on the selected line.
You can expand or collapse each line entry in a report to view specific details.
Example:
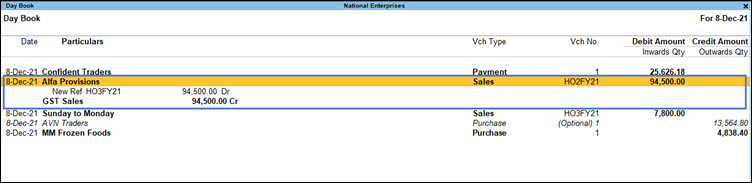
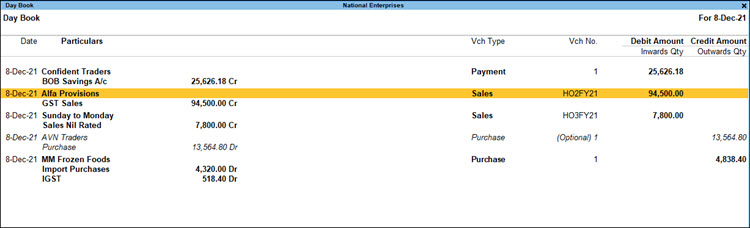
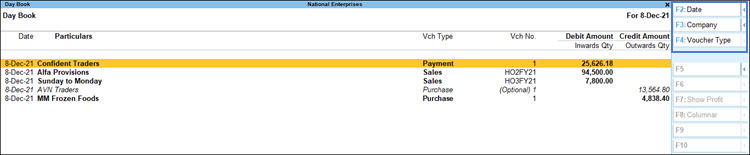
- In Day Book, press Shift+Enter to view details of a transaction, such as the participating ledgers. A sample image of the Day Book appears, as shown below:
- Similarly, in the Godown Summary report, press Shift+Enter on the selected godown to see the next level of data for that godown on the same screen. You can move to any of the lines in the next level and further explode the selected line using Shift+Enter.
- If you press Shift+Enter on Main Location till the last level, you can view the stock items, as shown below:
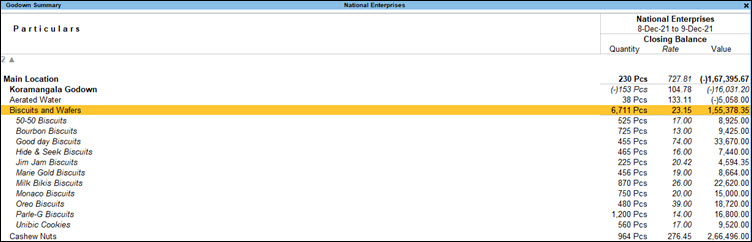
- If you press Shift+Enter on Main Location till the last level, you can view the stock items, as shown below:
2. Expand/collapse details of all line entries in the same report: Press Alt+F1 or Alt+F5.
In TallyPrime, you can view the next level of details for all line entries in a report in a single go.
Example: In Day Book, press Alt+F5 (Detailed) to view the next level of data for all the godowns appearing in the report.
3. View next level details in a separate report: Select a line > press Enter.
If you need to view the next level details of a line entry for a report in a different screen, you can do so by pressing Enter on the selected line.
Example: In Godown Summary, press Enter on the selected godown – say Main Location – to view the next level of data in a new screen. For example, if you press Enter on Main Location, the godown Koramangala Godown with other godowns and any additional stock groups will be shown in a new screen.
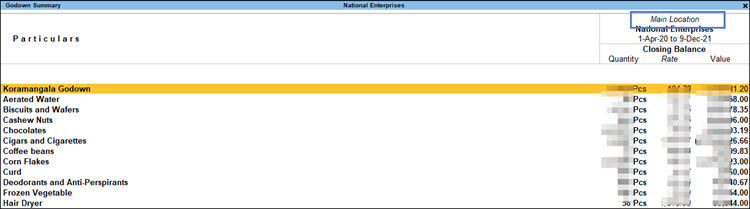
Upon drilling down to the last level of data (that is the stock item in this case), you can press Enter to open the monthly summary report, as in the case of other summary reports.
Stripe View
Using stripes in TallyPrime Release 5.0, you can view data in each row of any report distinctly. The Stripe View feature enhances the overall readability of data, and can also be used for Print, Export, E-mail, and WhatsApp.
Whether you have data in condensed or detailed mode, or in multiple columns, Stripe View is designed to support all such situations.
For more information, refer to the Enable Stripe View section in the Get Familiar with TallyPrime and TallyPrime Edit Log Features topic.
Once you have enabled Stripe View, you can view Day Book, as shown below:

When switched to detailed mode, you can view Day Book, as shown below:

The Stripe View feature works perfectly fine for reports where data is represented across multiple sections and each section remains independent of the other, such as Ratio Analysis report and Balance Sheet.
Once you have enabled Stripe View for Ratio Analysis, you can view the report, as shown below:
Once you have enabled Stripe View for Profit and Loss account, you can view the report, as shown below:

Keyboard Shortcuts – Select Lines | Remove & Restore Lines | Add, Insert, Duplicate Vouchers
To make your reports more handy, TallyPrime supports several keyboard shortcuts that can be used for quick actions within the reports. For example, when you are on Day Book, you may want to quickly add or insert a voucher, create a duplicate voucher entry, or even alter an existing voucher. Similarly, when you are viewing the Stock Summary or Godown Summary, you may want to remove a line showing negative value, and restore it back later. Using keyboard shortcut eliminates the need for moving away from the reports to perform an activity and optimises your time.
Bottom bar
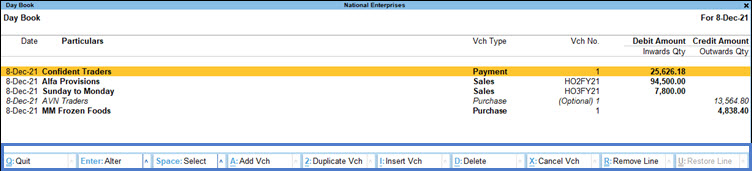
Starting Release 2.0.1, you will find all such keyboard shortcuts along with their corresponding actions on the bottom bar of every screen.
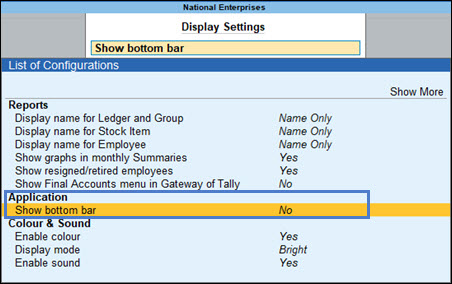
In case you want to hide the bottom bar from the screens:
- Press F1 (Help) > Settings > Display > Application > set Show bottom bar to No.
The following are a few examples of the actions that you perform using the keyboard shortcuts available on the bottom bar.
Select one or more lines
On any report
- To select a single line, press Spacebar.
- To select the next line (more than one line), press the down arrow > Spacebar.
- To select all the lines, press Ctrl+Spacebar.
Once the lines are selected, you can use the same keyboard shortcut to deselect the lines.
Remove and restore lines
In some reports, you may want to hide some of the lines to understand the details better. For example, you want to view Day Books with all lines except the Order vouchers. You can remove the line temporarily and restore it back in the report.
- Day Book > select one or more lines by pressing Spacebar > press Ctrl+R (Remove Line).
If you have removed multiple lines, and would want to restore all of them together, press Alt+U (Restore All).
Similarly, you can perform other actions, such as deleting vouchers (Alt+D), cancelling vouchers (Alt+X), or even quit (Ctrl+Q) the report – all of which are available on the bottom bar.
Right Buttons – Set Context | Sort & Filter Data | View Additional Details | Save View
While viewing any report, you will certainly want to further analyse the report details depending on your business requirements. For example, you may need to see the Balance Sheet based on a specific valuation method. Similarly, you will may want to see the profit made on all sales using the Day Book. You can also switch the context of any report from one company to another to perform specific actions. All such activities can be quickly done in reports using the right buttons.
Set Context for Reports
In TallyPrime, the top three buttons on the right button bar are used to set the context for your reports.
- F2: Date or F2: Period – Change the date or period of the report to view details specific to the specified period.
- F3: Company – Use this button to change the company instantly, without you having to close the current company.
- F4 – This button name differs based on the report you are viewing. However, the common use of this button is to set the context for the report to view related details. For example, in Day Book, you can set the context to view the details specific to Sales. Similarly, if you are viewing the Stock Summary, you can select a specific Stock Group to view the summary.
Sort & Filter and View Additional Report Details
The right buttons in reports enable you to further analyse the report data by sorting, filtering or viewing additional details specific to each report. Whether you want to view the profit-related details in Stock Summary or view ledger-wise Trial Balance, all of these are possible using the right buttons.
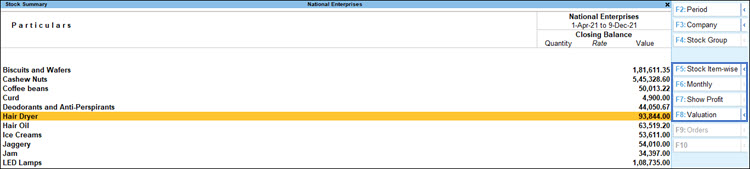
- Stock Summary > F5: Stock Item-wise – Displays the report with the summary of all stock items.
- Stock Summary > F6: Monthly – Displays the monthly summary for the stock groups.
- Similarly, Bills Payables > F6: Bills Receivables – Displays the details of all bills for which you are yet to receive the payments from your parties.
In reports, Alt+F5 in the right button bar can be used to view next set of details for a line, similar to using Alt+F1.
You can explore all such activities in different reports using the right buttons, based on your specific business needs.
Additionally, you can also use the following right buttons to configure the values and other details of your report, open specific views and related reports, or view exceptions.
- Basis of Values
- Change View
- Exception Reports
Refer to the following sections for more details.
Ctrl+B: Basis of Values | Value-Based Configurations
You can configure the values in your report for that instance, based on different business needs.
Example:
In Day Book, you can display the values based on the Type of Voucher Entries you select.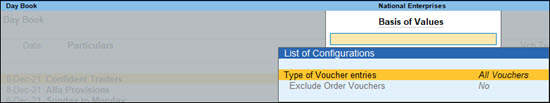
- Press Ctrl+B (Basis of Values) >Type of Voucher Entries > select Accounting Entries Only.
- Press Esc to view the default values.
Similarly, you can view the total values related to Forex Transactions only. Press Ctrl+B (Basis of Values) > Show Forex Transactions only > and press Enter.
Ctrl+H: Change View & Related Reports
You can display the details of a report in different views with additional details or for a specific period. You can also view other reports related to the current report.
Example:
In Stock Summary, you can change the details from Stock Group-wise view to Stock Item-wise view. You can also open related report for the same context of the Stock Summary.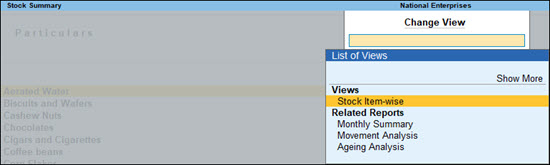
- Press Ctrl+H (Change View) > type or select Monthly Summary or Ageing Analysis > and press Enter.
- Press Esc to view the default report.
Ctrl+J: Exception Reports
For certain reports, you may want to view the exceptions to better assess the performance of your business. For example, you may have negative ledgers that have an impact on your overall cash or funds flow. Similarly, you may have created certain optional vouchers or post-dated vouchers while recording your day-to-day transactions. You will certainly want to see such vouchers separately as on a specific date. All such details are available as Exception Reports on the right button bar.
Example:
In Day Book
- Press Ctrl+J (Exception Report) > select the required report from List of Exception Report > press Enter.
Ctrl+L: Save View | Save Your Reports
When you view your reports, you would generally configure them based on specific business needs. At the same time, you may need to refer to the same report in regular intervals. If you are using TallyPrime Release 2.0 or later, you can save view of your reports in just a couple of steps. You can not only access the saved views of your reports, you can allow other users too to view and update as you need.
Example:
- Open Balance Sheet and configure as your need.
- Press Ctrl+L (Save View) and provide an appropriate name to the report.
Your report will start appearing in the list displayed under Go To.
Note that anytime you open the saved view of the report, you will be able to view real-time data for the period of the report you had saved.
For more details, refer to the Save View in TallyPrime topic.
Compare Report Details | New Column, Alter Column, Delete Column, Auto-Column
TallyPrime enables you to compare details in a report by displaying details in a new column as per your selected parameters. For example, you can compare stock summary for two different quarters or alter the parameters in the column when needed. You can also display data in repeated columns for based on a selected periodicity. Once you have compared the details as per your requirement, you can delete unnecessary columns.
Example:
In Stock Summary
- Press Alt+C (New Column) > set the required parameters > press Enter.
The report displays an additional column for comparison based on the parameters that you have set.
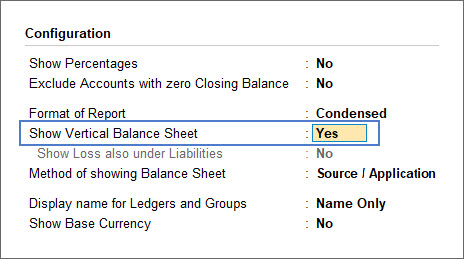
F12: Configure Reports
Each report is supported by a set of configurations that you may require while viewing the details of the report. You can enable or disable the configurations depending on your business-specific requirements.
Example:
In Balance Sheet
- Press F12 (Configure) > Show Vertical Balance Sheet: Yes.
Similarly, you can configure your reports, as needed.