
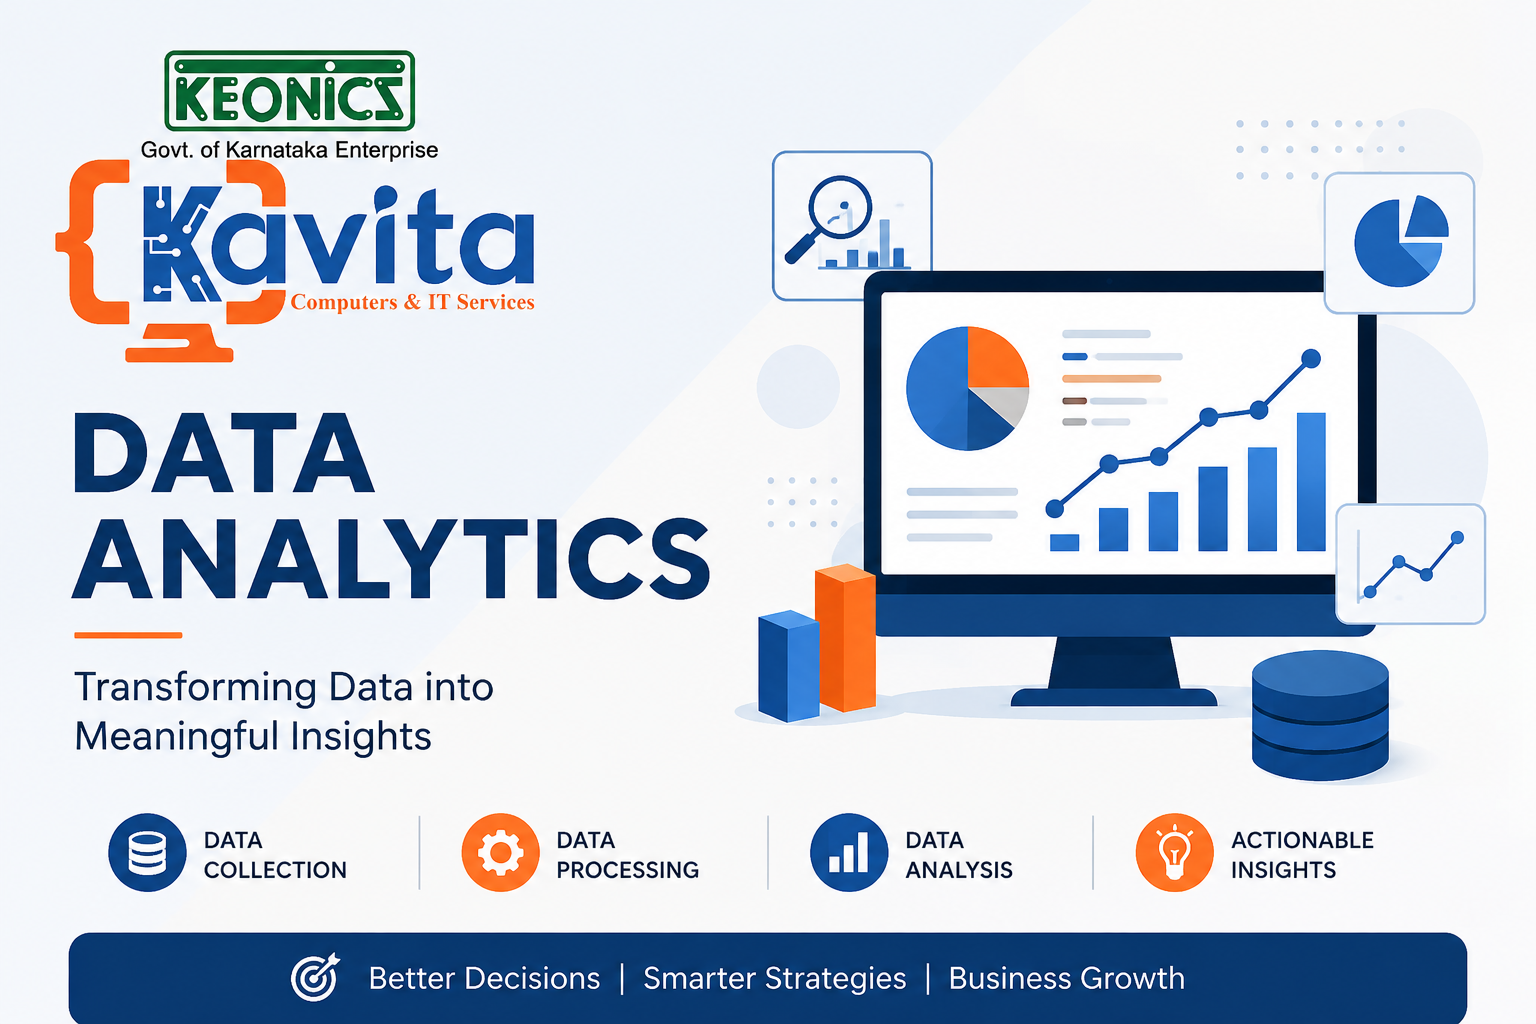
About Course
📊 Introduction to Data Analyst Course
The Data Analyst Course is designed to help learners develop the practical
skills required to collect, clean, analyze, visualize, and interpret data for
real-world decision-making.
In today’s data-driven world, organizations use data to understand customers,
monitor performance, identify trends, and make better business decisions.
This course provides a step-by-step learning path from basic data concepts
to practical data analysis and dashboard creation.
To develop the technical and analytical skills required to work with real-world
datasets and convert raw data into meaningful insights and reports.
📚 What You Will Learn
- Understanding Data Analytics and the Data Analyst role
- Microsoft Excel and Advanced Excel for Data Analysis
- Data cleaning and data preparation
- Formulas and functions used in data analysis
- Pivot Tables, Pivot Charts, and Interactive Dashboards
- SQL for extracting and analyzing database data
- Python programming fundamentals for Data Analysis
- NumPy and Pandas for data manipulation
- Data visualization using charts and graphs
- Power BI for interactive reports and dashboards
- Working with real-world datasets and business problems
- Creating analytical reports and presenting insights
🛠️ Tools & Technologies
| Tool / Technology | Purpose |
|---|---|
| MS Excel | Data cleaning, formulas, analysis and dashboards |
| SQL | Querying and analyzing database data |
| Python | Programming and data analysis |
| Pandas & NumPy | Data manipulation and numerical analysis |
| Power BI | Data visualization and interactive dashboards |
The course focuses on practical, real-life examples. You will work
with datasets such as student records, sales data, customer information,
employee data, and business reports to understand how data analysts solve
real-world problems.
📈 Learning Outcome
After completing this course, learners will be able to:
- Understand and analyze structured datasets.
- Clean and prepare raw data for analysis.
- Perform calculations and statistical analysis.
- Write SQL queries to retrieve useful information.
- Use Python libraries for data analysis.
- Create meaningful charts and visualizations.
- Build professional Excel and Power BI dashboards.
- Identify trends, patterns, and important business insights.
- Present analytical findings in a clear and understandable manner.
Data Analysis is not only about learning tools. A successful Data Analyst must
understand the business problem, ask the right questions, analyze the data,
and communicate meaningful insights.
🚀 Course Journey
Excel → SQL → Python → Data Cleaning → Data Analysis → Visualization → Power BI → Projects
By the end of the course, learners will have a strong foundation in Data Analytics
and practical experience in converting raw data into useful information for
decision-making.
Course Content
Introduction to Data Analytics
-
What is Data Analytics?
-
Types of Data Analytics
-
Data Analyst Role & Responsibilities
Data Analytics Tools & Technologies
Student Ratings & Reviews